Flowing triangles
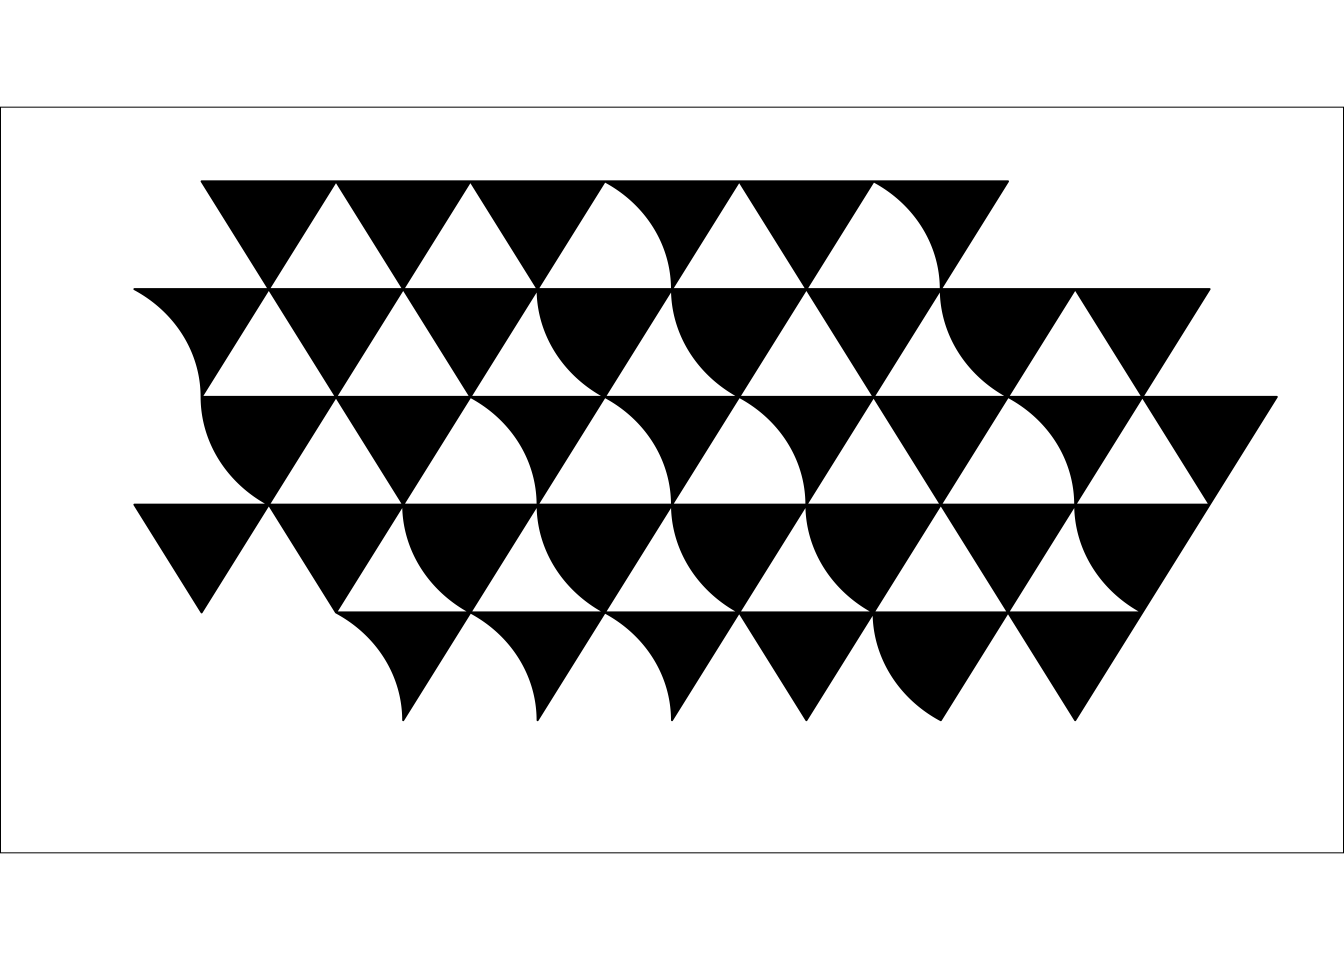
I have admired the work of the artist Bridget Riley for a long time. She is now in her eighties, but as it seems still very creative and productive. Some of her recent work combines simple triangles in fascinating compositions. The longer I look at them, the more patterns I recognise.
Yet, the actual painting can be explained easily, in a sense of a specification document to reproduce the pattern precisely. However, seeing the real print, as I had the chance at the London Art Fair last week, and a reproduction on the screen is incommensurable.
Having said that, I could not resist programming a figure that resembles the artwork labelled Bagatelle 2. Well, at least I can say that I learned more about grid [1], grid.path [2] and gridSVG [3] in R.
library(data.table)
ya <- sqrt(3) * 0.5
yp <- c(2, 2, 2 - ya)
x_iter <-c(1:6, 0.5:7.5, 1:8, 0.5:7.5, 2:7)
DT <- data.table(
  x = unlist(lapply(x_iter,
                    function(t) c(1, 2, 1.5) + t)),
  y = c(rep(yp, 6) + 4, rep(yp, 8) + 4 - ya,
        rep(yp, 8) + 4 - 2*ya, rep(yp, 8) + 4 - 3*ya,
        rep(yp, 6) + 4 - 4*ya),
  id = rep(1:36, each=3)
)
n <- 49
t <- seq(pi*7/3, pi*2, length=n)
xin <- cos(t) - min(cos(t))
yin <- sin(t) - max(sin(t))
xout <- cos(t - pi) - min(cos(t - pi))
yout <- sin(t - pi)
DT <- rbindlist(
  list(
    DT,
    rbindlist(lapply(c(10, 11, 13, 15, 25:28, 30, 35), function(i){
      data.table(x=DT[id==i, x][3] - xin,
                 y=DT[id==i, y][3] - yin, id=i)
    })),
    rbindlist(lapply(c(4, 6, 7, 17:19, 21, 31:33), function(i){
      data.table(x=DT[id==i, x][3] - rev(xout),
                 y=rev(DT[id==i, y][3] - yout), id=i)
    }))
  )
)
xmax=max(DT[,x])
ymax=max(DT[,y])
library(grid)
grid.newpage()
pushViewport(
viewport(name="vp1",
layout=grid.layout(1,1,
widths=9,
heights=5,
respect=TRUE)))
pushViewport(
viewport(name="vp2", layout.pos.row=1,
layout.pos.col=1, xscale=range(DT[,x]),
yscale=range(DT[,y]), clip=TRUE))
grid.rect(gp=gpar(fill="white"))
grid.path(DT[,x]/xmax-0.05, DT[,y]/ymax-0.1, id=DT[,id],
gp=gpar(fill="black"))
References
- [1] P. Murrell. R Graphics, Second Edition. CRC Press. 2011
- [2] P. Murrell. What’s in a Name? . The R Journal, 4(2):5–12, dec 2012.
- [3] P. Murrell and S. Potter. gridSVG: Export grid graphics as SVG. R package 1.5-0. 2015
Citation
For attribution, please cite this work as:Markus Gesmann (Jan 26, 2016) Flowing triangles. Retrieved from https://magesblog.com/post/2016-01-26-flowing-triangles/
@misc{ 2016-flowing-triangles,
author = { Markus Gesmann },
title = { Flowing triangles },
url = { https://magesblog.com/post/2016-01-26-flowing-triangles/ },
year = { 2016 }
updated = { Jan 26, 2016 }
}