Adding mathematical notations to R plots
I have to admit that I find the plotmath expressions in R a little fiddly to annotate plots with mathematical notation.
Apparently I am not the only one, but Stefano Meschiari did actually something about it. A few days ago his package latex2exp appeared on CRAN.
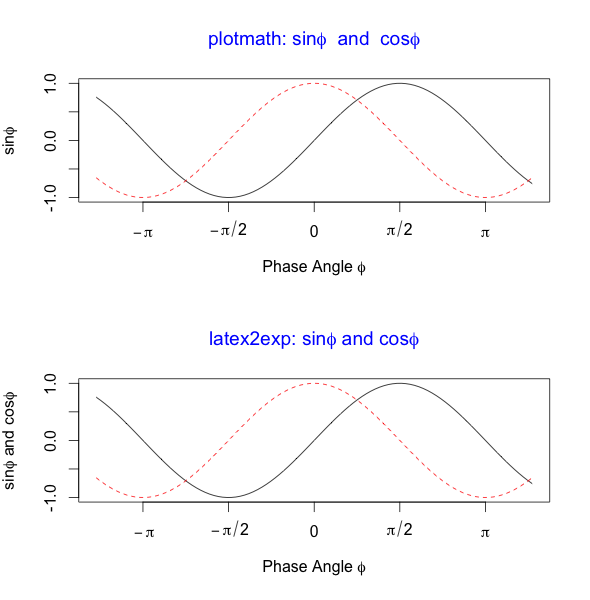
The package provides the wonderful function latex2exp that translates LaTeX code into plotmath expressions. Brillant! All I have to remember is to escape the “" character, that is write ”\\“ instead of ”".
Below is the first example from the plotmath help file and again using latex2exp. I think this is much easier to read and write.
 You find more information about
 latex2exp on Stefano’s web site and his GitHub repository.Session Info
R version 3.2.1 (2015-06-18)
Platform: x86_64-apple-darwin13.4.0 (64-bit)
Running under: OS X 10.10.4 (Yosemite)

locale:
[1] en_GB.UTF-8/en_GB.UTF-8/en_GB.UTF-8/C/en_GB.UTF-8/en_GB.UTF-8

attached base packages:
[1] stats graphics grDevices utils datasets methods base

other attached packages:
[1] latex2exp_0.3.1

loaded via a namespace (and not attached):
[1] magrittr_1.5 tools_3.2.1 Rcpp_0.11.6 stringi_0.5-5 stringr_1.0.0
Citation
For attribution, please cite this work as:Markus Gesmann (Jul 07, 2015) Adding mathematical notations to R plots. Retrieved from https://magesblog.com/post/2015-07-07-adding-mathematical-notations-to-r-plots/
@misc{ 2015-adding-mathematical-notations-to-r-plots,
author = { Markus Gesmann },
title = { Adding mathematical notations to R plots },
url = { https://magesblog.com/post/2015-07-07-adding-mathematical-notations-to-r-plots/ },
year = { 2015 }
updated = { Jul 07, 2015 }
}