googleVis 0.5.5 released
Earlier this week we released googleVis 0.5.5 on CRAN. The package provides an interface between R and Google Charts, allowing you to create interactive web charts from R. This is mainly a maintenance release, updating documentation and minor issues.
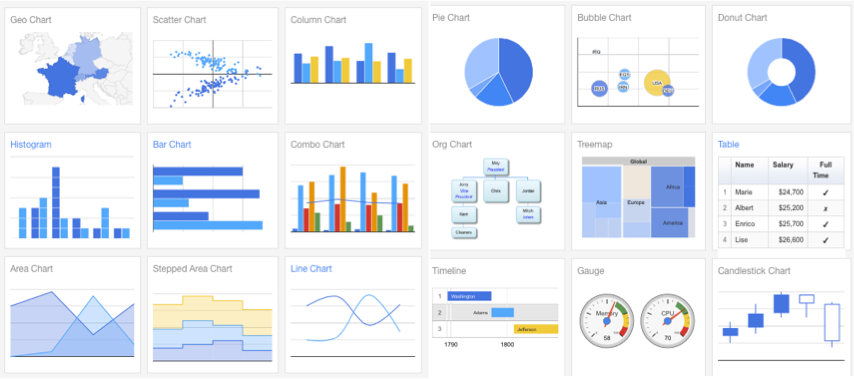 |
| Screen shot of some of the Google Charts |
New to googleVis? Review the examples of all googleVis charts on CRAN.
Perhaps the best known example of the Google Chart API is the motion chart, popularised by Hans Rosling in his 2006 TED talk.R Code
Session Info
R version 3.1.1 (2014-07-10)
Platform: x86_64-apple-darwin13.1.0 (64-bit)

locale:
[1] en_GB.UTF-8/en_GB.UTF-8/en_GB.UTF-8/C/en_GB.UTF-8/en_GB.UTF-8

attached base packages:
[1] stats graphics grDevices utils datasets methods base

other attached packages:
[1] googleVis_0.5.5 WDI_2.4 RJSONIO_1.3-0

loaded via a namespace (and not attached):
[1] tools_3.1.1
Citation
For attribution, please cite this work as:Markus Gesmann (Aug 19, 2014) googleVis 0.5.5 released. Retrieved from https://magesblog.com/post/2014-08-19-googlevis-055-released/
@misc{ 2014-googlevis-0.5.5-released,
author = { Markus Gesmann },
title = { googleVis 0.5.5 released },
url = { https://magesblog.com/post/2014-08-19-googlevis-055-released/ },
year = { 2014 }
updated = { Aug 19, 2014 }
}