Notes from the Kölner R meeting, 23 May 2014
The 10th Kölner R user meeting took place last Friday at the Institute of Sociology and to celebrate the anniversary we invited Andrie de Vries to join us from Revolution Analytics. Andrie is well known in the R community; he is the co-author of the R for Dummies book and an active contributor on stackoverflow.
Taking R to the Enterprise
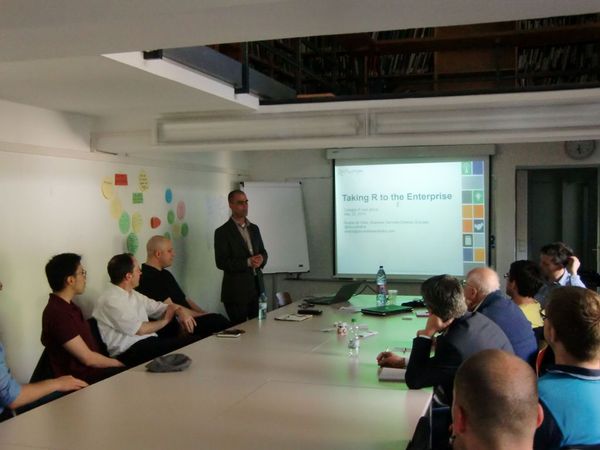
Andrie de Vries
Andrie de Vries: Taking R to the Enterprise. Photo: Günter Faes
Andrie talked about how R is finding its way into the enterprise. He argued that R has become the go-to tool for data and statistical analysis in many companies. He observed that over the years the commercial user base evolved from a small expert community with a love for the command line and cutting edge technology into a much wider audience. Although R is still used by the technical experts, who demand more and more power, out-of-memory computations on bigger data, etc. the number of casual R users is growing rapidly. Often the casual R user relies on code written by others as part of a bigger workflow and hence prefers a more standardised user interface.
Andrie illustrated how Revolution Analytics aims to satisfy both user groups. He started with the expert R users by demonstrating Revolution Analytics’ RevoScaleR package that allows them to carry out analysis on bigger data. His example followed closely the airline analysis of Joseph Rickert’s white paper. Andrie then showed how more complex R code and functions can be integrated (and to some extend hidden) into Alteryx and Tableau via Rserve.
googleVis overview & developments
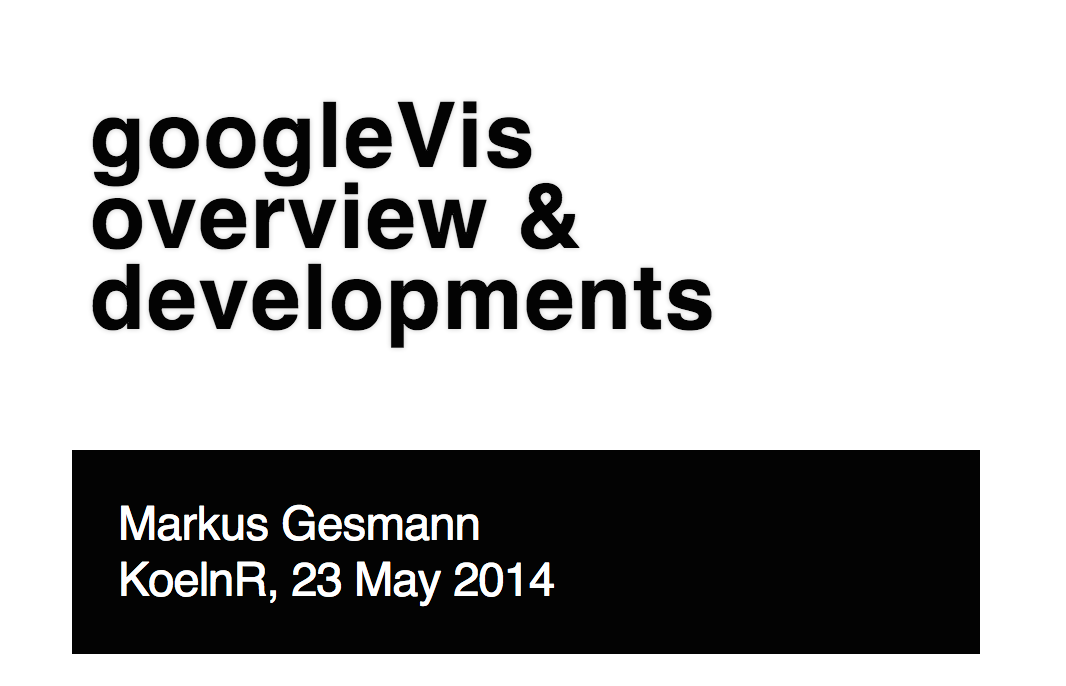
googleVis Update
Slides and code available on GitHub
I gave a brief introduction to googleVis and presented recent developments. The googleVis package provides an interface between R and the Google Chart Tools API. It allows users to create web pages with interactive charts based on R data frames and to display them either via the local R HTTP help server or within their own sites, without uploading the data to Google. The best known example is perhaps the motion chart of fertility and life expectancy data from the World Bank as first presented by Hans Rosling. Another popular example is the chart that illustrates the performance of the famous Lloyd’s insurance market.
Since version 0.5.0 of googleVis many new chart types have been added to googleVis, including annotation, sankey, calendar and timeline charts. Additionally new markdown vignettes have been included to present the examples also on CRAN. The slides and rmarkdown code are available via GitHub.
Kölsch & Schnitzel
No Kölner R meeting would be complete without a few Kölsch and Schnitzel at the Lux. We were lucky with the weather so that we could sit outside to enjoy drinks, food and networking opportunities.
 ]
]
Kölsch and Schnitzel at the Lux. Photo: Günter Faes
Next Kölner R meeting
The next meeting is scheduled for 12 September 2014.
Please get in touch if you would like to present and share your experience, or indeed if you have a request for a topic you would like to hear more about. For more details see also our Meetup page.
Thanks again to Bernd Weiß for hosting the event and Revolution Analytics for their sponsorship.
Citation
For attribution, please cite this work as:Markus Gesmann (May 27, 2014) Notes from the Kölner R meeting, 23 May 2014. Retrieved from https://magesblog.com/post/2014-05-27-notes-from-kolner-r-meeting-23-may-2014/
@misc{ 2014-notes-from-the-kolner-r-meeting-23-may-2014,
author = { Markus Gesmann },
title = { Notes from the Kölner R meeting, 23 May 2014 },
url = { https://magesblog.com/post/2014-05-27-notes-from-kolner-r-meeting-23-may-2014/ },
year = { 2014 }
updated = { May 27, 2014 }
}