Adding labels within lattice panels by group
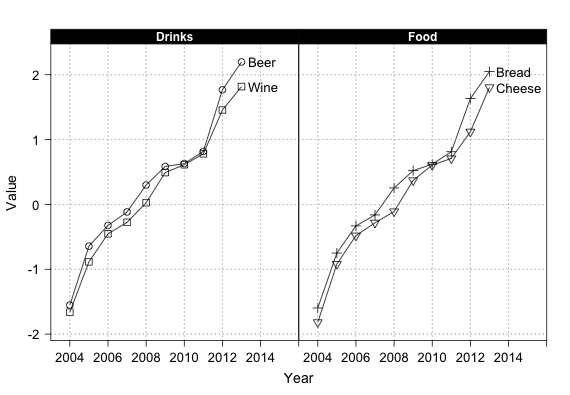
The other day I had data that showed the development of many products over time. I grouped the products into categories and visualised the data as line graphs in lattice. But instead of adding an extensive legend to the plot I wanted to add labels to each line’s latest point. How do you do that? It turns out that panel.groups
is there to help again.

R code
set.seed(12345) | |
dat <- data.frame(category=rep(c("Food", "Drinks"),20), | |
product=rep(c("Cheese", "Wine", "Bread", "Beer"), 10), | |
year=sort(rep(c(2004:2013),4)), | |
value=sort(rnorm(40))) | |
dat <- dat[with(dat, order(category, year)),] | |
library(lattice) | |
# Change some of the default lattice settings | |
my.settings <- canonical.theme(color=FALSE) | |
my.settings[['strip.background']]$col <- "black" | |
my.settings[['strip.border']]$col<- "black" | |
xyplot(value ~ year | category, | |
groups=product, data=dat, | |
as.table=TRUE, | |
xlim=c(2003, 2016), # range of x-axis | |
scales=list(cex=c(1.1, 1.1), # increase font size | |
alternating=1, # axes labels left/bottom | |
tck = c(1,0)), # ticks only with labels | |
par.settings = my.settings, | |
cex=1.1, # change size of symbols | |
xlab=list(label="Year", fontsize=14), | |
ylab=list(label="Value", fontsize=14), | |
par.strip.text=list(col="white", font=2), | |
panel=panel.superpose, | |
panel.groups=function(x,y, group.number,...){ | |
panel.xyplot(x,y,t="b",...) | |
panel.grid(v=-1, h=-1, lty=3) | |
xt <- x[x==max(x)] # find latest year | |
yt <- y[x==max(x)] # find value at latest year | |
panel.text(xt, yt, labels=levels(dat$product)[group.number], | |
pos=4, # show labels on right side | |
...) | |
} | |
) |
Session Info
R version 3.0.2 (2013-09-25)
Platform: x86_64-apple-darwin10.8.0 (64-bit)
locale:
[1] en_GB.UTF-8/en_GB.UTF-8/en_GB.UTF-8/C/en_GB.UTF-8/en_GB.UTF-8
attached base packages:
[1] stats graphics grDevices utils datasets methods base
other attached packages:
[1] lattice_0.20-24
loaded via a namespace (and not attached):
[1] grid_3.0.2
Citation
For attribution, please cite this work as:Markus Gesmann (Feb 18, 2014) Adding labels within lattice panels by group. Retrieved from https://magesblog.com/post/2014-02-18-adding-labels-within-lattice-panels-by/
@misc{ 2014-adding-labels-within-lattice-panels-by-group,
author = { Markus Gesmann },
title = { Adding labels within lattice panels by group },
url = { https://magesblog.com/post/2014-02-18-adding-labels-within-lattice-panels-by/ },
year = { 2014 }
updated = { Feb 18, 2014 }
}