Review: Kölner R Meeting 19 July 2013
Despite the hot weather and the beginning of the school holiday season in North Rhine Westphalia the Cologne R user group met yet again for two fascinating talks and beer and schnitzel afterwards.
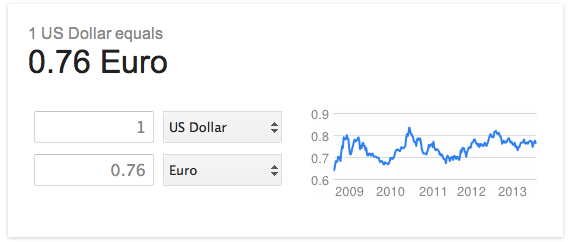
Analysing Twitter data to evaluate the US Dollar / Euro exchange rates
Dietmar Janetzko presented ideas to forecast US Dollar / Euro exchange rate movements for the following day.
 To forecast exchange rate movements, Dietmar distinguishes two school of thoughts. The first one is based on the analysis of fundamental analysis, e.g. figures of GDP, debt, unemployment, etc. and the other one is based on news, e.g. announcements from central banks, e.g. from Ben Bernanke and other industry experts.
While the data for the fundamental analysis is usually updated slowly, e.g. annually or quarterly, news can be of higher frequency and less regular. As a result the forecasting horizon in a very liquid market, as the forex market, can vary from one minute or less to next year or decade.
Dietmar’s aim was to forecast the exchange rate for the following day and to outperform the forecast of a random walk. For his experiment he used daily exchange rates from Quandl, which has a nice R interface, and Twitter data from topsy, which gives him access to Twitter’s ‘firehose’.
For his analysis Dietmar focused on the number of tweets of the terms Euro + Crisis + <concept>, whereby he used a dictionary of nearly 600 different concept words.
His training algorithms used functions of the following packages: forecast, caret and car, looking for predictors that have a smaller error than a random error.
It goes without saying that Dietmar hasn’t made millions from his algorithms yet, but the discussion and the end of his presentation will hopefully have given him a few pointers to do just that.
Graphs in R
Afshin Sadeghi, who has a background in Steiner tree methods for Protein-Protein interaction networks, gave an overview of the various graph packages in R. He started his talk with a little overview of the graph terminology of nodes, edges, trees, directed and undirected graphs.
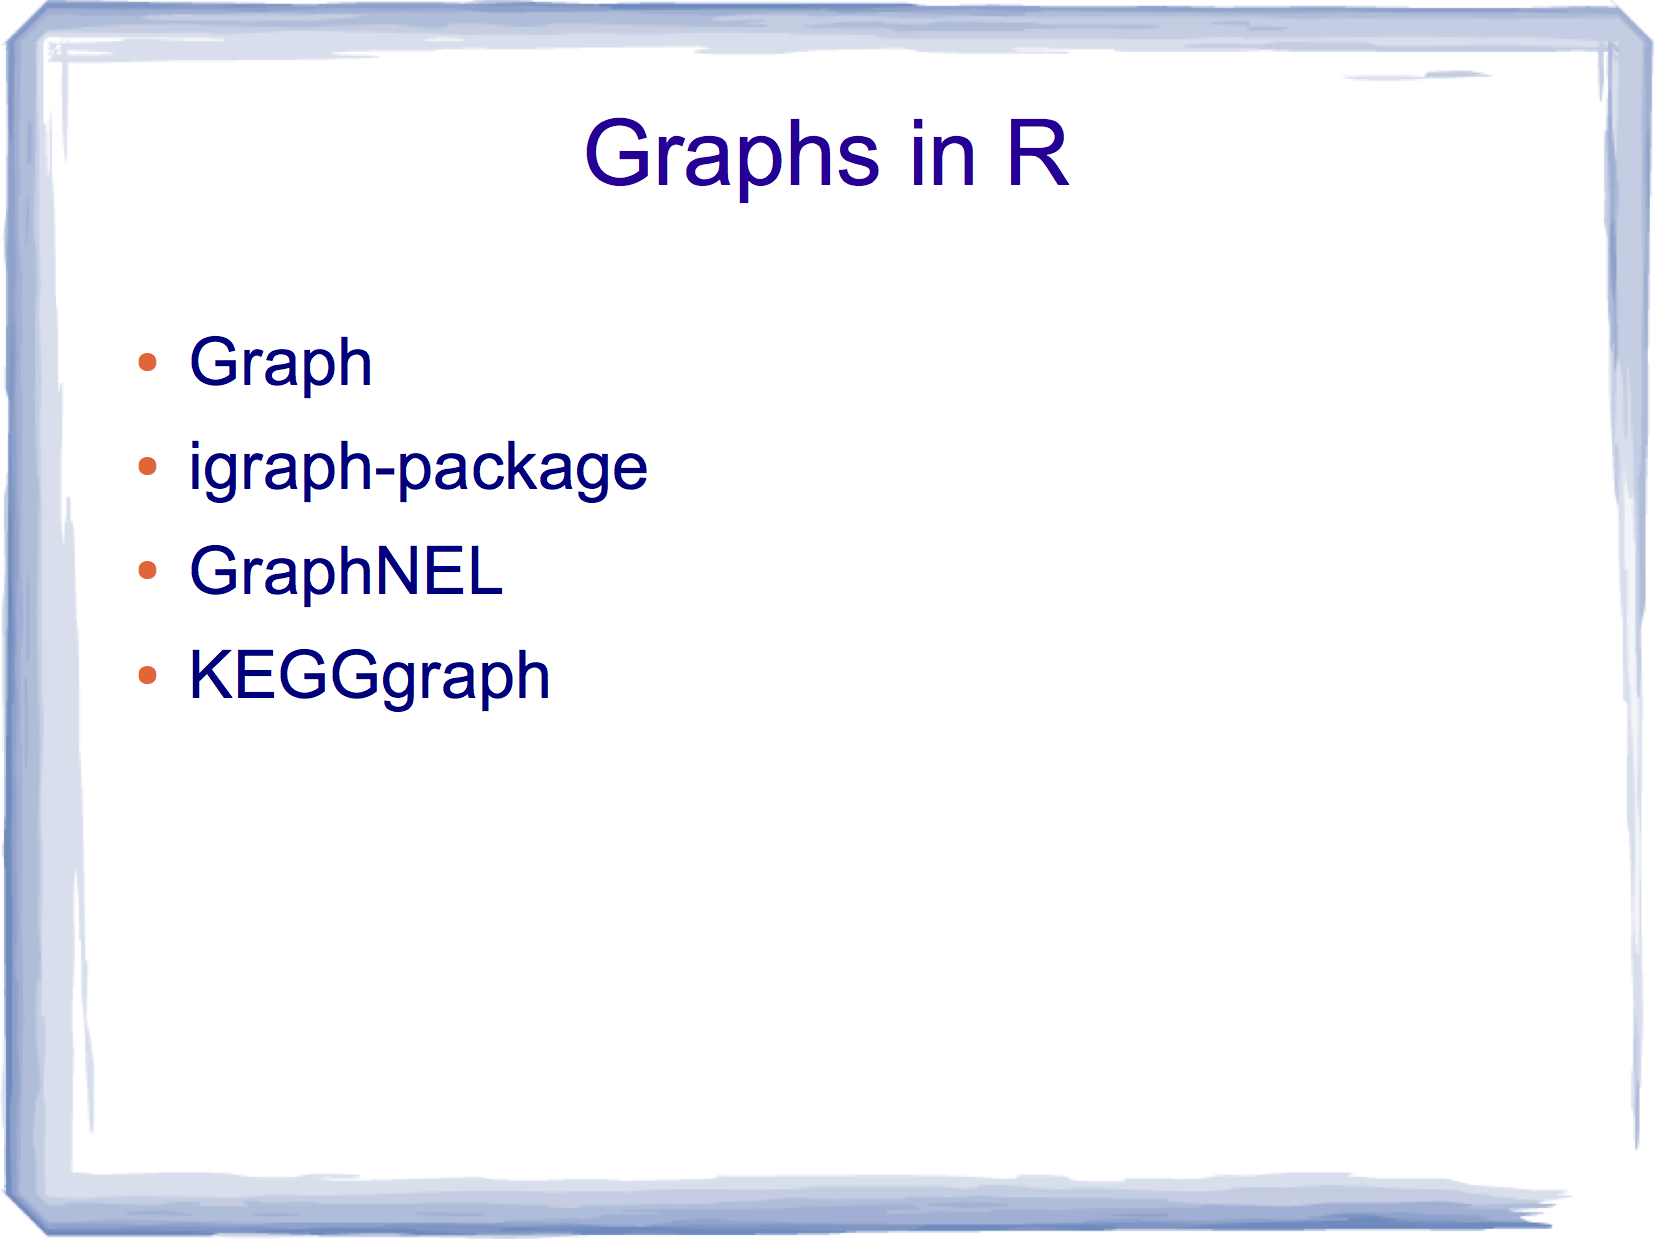 Afshin then gave a brief overview of the various graph packages in R and the different visualisation options. The most popular package seems to be
 igraph, maintained by Gabor Csardi. Although different packages use sometimes different graph objects, there are often conversation tools available, e.g. igraph.to.graphNEL, allowing users to use the best algorithms from all packages.
You can access Afshin’s slides via our Meetup site.
Next Kölner R meeting
The next meeting has been scheduled for 18 October 2013.
Please get in touch if you would like to present and share your experience, or indeed if you have a request for a topic you would like to hear more about. For more details see also our Meetup page.
Thanks again to Bernd Weiß for hosting the event and Revolution Analytics for their sponsorship.
Citation
For attribution, please cite this work as:Markus Gesmann (Jul 23, 2013) Review: Kölner R Meeting 19 July 2013. Retrieved from https://magesblog.com/post/2013-07-23-review-kolner-r-meeting-19-july-2013/
@misc{ 2013-review-kolner-r-meeting-19-july-2013,
author = { Markus Gesmann },
title = { Review: Kölner R Meeting 19 July 2013 },
url = { https://magesblog.com/post/2013-07-23-review-kolner-r-meeting-19-july-2013/ },
year = { 2013 }
updated = { Jul 23, 2013 }
}