Interactive presentation with slidify and googleVis
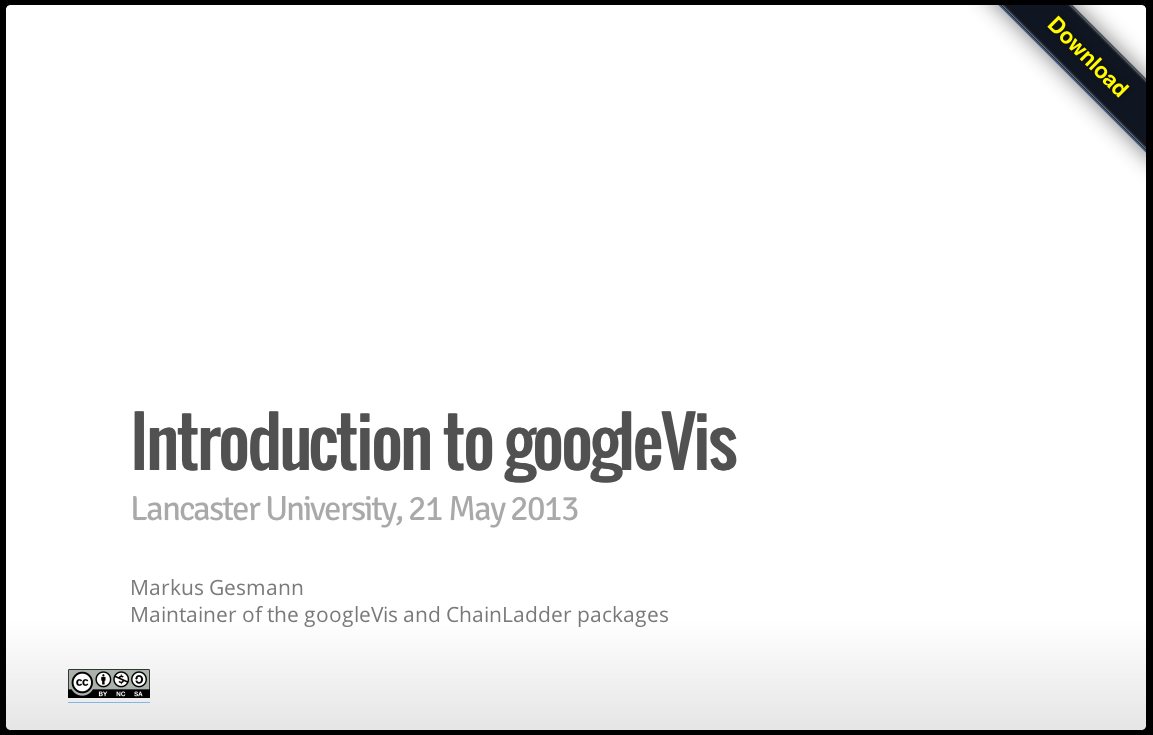
Last week I was invited to give an introduction to googleVis at Lancaster University. This time I decided to use the R package slidify for my talk. Slidify, like knitr, is built on Markdown and makes it very easy to create beautiful HTML5 presentations.
 |
| Introduction to googleVis |
- RMarkdown helps me to focus on the content
- Integration of R code is build in
- HTML5 allows me to embed interactive content, such as
In the past I have used knitr in combination with pandoc to generate a slidy presentation. However, with slidfiy I can do all this in R directly. And better, Ramnath provides me with a choice of different layout frameworks and syntax highlighting options. Finally to top it all, publishing the slides on Github was only one more R statement: publish(‘mages’, ‘Introduction_to_googleVis’).
I will give a half-day tutorial on googleVis with Diego de Castillo at useR2013! in Albacete on 9 July 2013. I hope to see some of you there.
Citation
For attribution, please cite this work as:Markus Gesmann (May 28, 2013) Interactive presentation with slidify and googleVis. Retrieved from https://magesblog.com/post/2013-05-28-interactive-presentation-with-slidify/
@misc{ 2013-interactive-presentation-with-slidify-and-googlevis,
author = { Markus Gesmann },
title = { Interactive presentation with slidify and googleVis },
url = { https://magesblog.com/post/2013-05-28-interactive-presentation-with-slidify/ },
year = { 2013 }
updated = { May 28, 2013 }
}