London Olympics and a prediction for the 100m final
It is less than a week before the 2012 Olympic games will start in London. No surprise therefore that the papers are all over it, including a lot of data and statistics around the games.
The Economist investigated the potential financial impact on sponsors (some benefits), tax payers (no benefits) and the athletes (if they are lucky) in its recent issue
The Guardian has a whole series around the Olympics, including the data of all Summer Olympic Medallists since 1896.100m men final
The biggest event of the Olympics will be one of the shortest: the 100 metres men final. It will be all over in less than 10 seconds. In 1968 Jim Hines was the first gold medal winner, who achieved a sub-ten-seconds time and since 1984 all gold medal winners have run faster than 10 seconds. The historical run times of the past Olympics going back to 1896 are available from databasesport.com.
Looking at the data it appears that a simple log-linear model will give a reasonable forecast for the 2012 Olympic’s result (ignoring the 1896 time). Of course such a model doesn’t make sense forever, as it would suggest that future run-times will continue to shrink. Hence, some kind of logistics model might be a better approach, but I have no idea what would be a sensible floor for it. Others have used ideas from extreme value theory to investigate the 100m sprint, see the paper by Einmahl and Smeets, which would suggest a floor greater than 9 seconds.
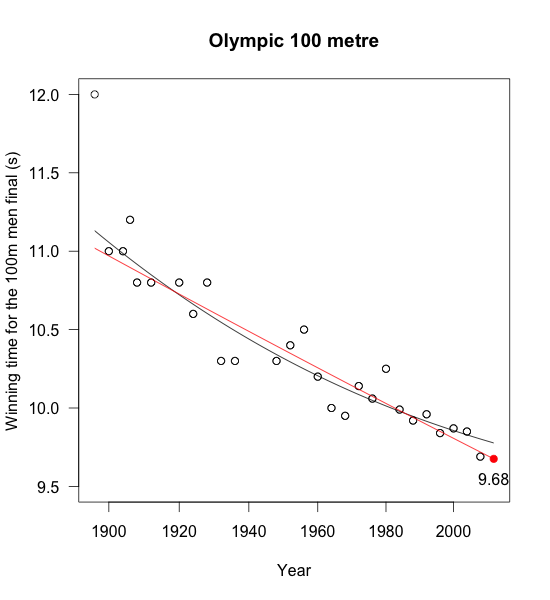 |
| Historical winning times for the 100m mean final. Red line: log-linear regression, black line: logistic regression. |
My simple log-linear model forecasts a winning time of 9.68 seconds, which is 1/100 of a second faster than Usain Bolt’s winning time in Beijing in 2008, but still 1/10 of a second slower than his 2009 World Record (9.58s) in Berlin.
Never-mind, I shall stick to my forecast. The 100m final will be held on 5 August 2012. Now even I get excited about the Olympics, and be it for less than 10 seconds.
R code
Here is the R code used in this the post:
library(XML)
library(drc)
url <- "http://www.databaseolympics.com/sport/sportevent.htm?enum=110&sp=ATH"
data <- readHTMLTable(readLines(url), which=2, header=TRUE)
golddata <- subset(data, Medal %in% "GOLD")
golddata$Year <- as.numeric(as.character(golddata$Year))
golddata$Result <- as.numeric(as.character(golddata$Result))
tail(golddata,10)
logistic <- drm(Result~Year, data=subset(golddata, Year>=1900), fct = L.4())
log.linear <- lm(log(Result)~Year, data=subset(golddata, Year>=1900))
years <- seq(1896,2012, 4)
predictions <- exp(predict(log.linear, newdata=data.frame(Year=years)))
plot(logistic,  xlim=c(1896,2012),
     ylim=c(9.5,12),
     xlab="Year", main="Olympic 100 metre",
     ylab="Winning time for the 100m men's final (s)")
points(golddata$Year, golddata$Result)
lines(years, predictions, col="red")
points(2012, predictions[length(years)], pch=19, col="red")
text(2012, 9.55, round(predictions[length(years)],2))
Update 5 August 2012
You find a comparison of my forecast to the final outcome of Usain Bolt’s winning time of 9.63s on my follow-up post.
Citation
For attribution, please cite this work as:Markus Gesmann (Jul 22, 2012) London Olympics and a prediction for the 100m final. Retrieved from https://magesblog.com/post/2012-07-22-london-olympics-and-prediction-for-100m/
@misc{ 2012-london-olympics-and-a-prediction-for-the-100m-final,
author = { Markus Gesmann },
title = { London Olympics and a prediction for the 100m final },
url = { https://magesblog.com/post/2012-07-22-london-olympics-and-prediction-for-100m/ },
year = { 2012 }
updated = { Jul 22, 2012 }
}