Hierarchical Compartmental Reserving Models for Business Planning
Introduction
It’s been three years since the Casualty Actuarial Society published our research paper on Hierarchical Compartmental Reserving Models (Gesmann and Morris (2020)). Time to revisit it, as developments of the Stan language, and its interfaces such as cmdstanr and brms have progressed and simplified the treatment of differential equations.
We have updated the bookdown version version of the paper to take advantage of these newer versions.

This post will give another example of how to use hierarchical compartmental reserving models, but rather than working with historical claims data, we use the model to generate future data, as may be required for a business plan of a new product, where no historical data exists.
A prior predictive model can be used to project cash flows and create a reserving model from day one. This model can be updated as actual claims data becomes available. More importantly, the model can be used to assess whether the business plan assumptions about rate changes, loss ratios, and reporting and payment delays are still valid.
Model
Let’s consider the accident years 2024 - 2027, including a view on future rate movements:
library(data.table)
dev_n <- 48
ay_start <- 2024
ay_end <- 2027
ay_n <- ay_end - ay_start + 1

CycleIndex <- data.table(
  accident_year = (ay_start:ay_end),
  RateIndex = c(1, 1.1, 1.05, 0.95)
)
Following the example from Section 3 in the paper we model incremental paid and outstanding claims simultaneously, with common factors for the reported loss ratio \((RLR)\) and reserve robustness factor \((RRF)\). The claims process dynamics, i.e. the speed of earnings and payments are set via the parameters \(k_{er}\) and \(k_p\). Finally, we use a dummy variable \(\delta\) again to distinguish between paid \((\delta = 1)\) and outstanding claims \((\delta = 0)\):
library(brms)
claims_dynamics <- "
// ODE system
vector compartmentmodel(real t, vector y, vector theta) {
  vector[3] dydt;
  // Define ODEs
  dydt[1] = - theta[1] * y[1];                            // exposure
  dydt[2] = theta[1] * theta[3] * y[1] - theta[2] * y[2]; // outstanding
  dydt[3] = theta[2] * theta[4] * y[2];                   // paid

  return dydt;
  }

real incrclaimsprocess(real t, real devfreq, real ker, real kp,
                       real RLR, real RRF, real delta){
    vector[3] y0;
    array[1] vector[3] y;
    vector[4] theta;
    theta[1] = ker; theta[2] = kp;
    theta[3] = RLR; theta[4] = RRF;
    real out;
    // Set initial values
    y0[1] = 1; // Exposure
    y0[2] = 0; // Outstanding
    y0[3] = 0; // Paid

    y = ode_rk45(compartmentmodel, y0, 0, rep_array(t, 1), theta);
    out = y[1, 2] * (1 - delta) + y[1, 3] * delta;

    if( (delta > 0) && (t > devfreq) ){ // paid greater dev period 1
    // incremental paid
     y = ode_rk45(compartmentmodel, y0, 0,
                  rep_array(t - devfreq, 1), theta);
     out = out - y[1, 3];
    }
    return(out);
}
"
Using the formula interface in brms we can set the model structure and various prior assumptions:
frml <- bf(loss_ratio ~ log(eta),
           nlf(eta ~ incrclaimsprocess(dev, 1.0, ker, kp,
                                       RLR, RRF, delta)),
           nlf(ker ~ 0.1 * exp(oker * 0.05)),
           nlf(kp ~ 0.5 * exp(okp * 0.025)),
           nlf(RLR ~ 0.55 * exp(oRLR * 0.025) / RateIndex),
           nlf(RRF ~ exp(oRRF * 0.05)),
           oRLR ~ 1 + (1 | ID | accident_year),
           oRRF ~ 1 + (1 | ID | accident_year),
           oker ~ 1,
           okp ~ 1,
           sigma ~ 0 + deltaf, nl = TRUE)
mypriors <- c(prior(normal(0, 1), nlpar = "oRLR"),
prior(normal(0, 1), nlpar = "oRRF"),
prior(normal(0, 1), nlpar = "oker"),
prior(normal(0, 1), nlpar = "okp"),
prior(normal(log(0.1), 0.05), class = "b",
coef="deltafPaid", dpar= "sigma"),
prior(normal(log(0.05), 0.02), class = "b",
coef="deltafOutstanding", dpar= "sigma"),
prior(student_t(10, 0, 0.05), class = "sd", nlpar = "oRLR"),
prior(student_t(10, 0, 0.05), class = "sd", nlpar = "oRRF"),
prior(lkj(1), class="cor"))Prior predictive simulations
Before we can sample from the above model we have to create dummy data with the model structure, i.e. accident years, development months, loss types and dummy loss ratios (here set to 1):
DT1 <- data.table(
  accident_year = rep(ay_start:(ay_start + ay_n - 1),
                      each = dev_n),
  dev = rep(1 : dev_n, ay_n),
  loss_ratio = 1
)
DT2 <- rbindlist(list(
  data.table(DT1, delta = 0, deltaf = "Outstanding"),
  data.table(DT1, delta = 1, deltaf = "Paid")
))
# Add rate index information
setkey(DT2, accident_year)
setkey(CycleIndex, accident_year)
myDT <- CycleIndex[DT2]
To run prior simulations we set the sample_prior argument to "only". Note also that we use cmdstan as the back end.
nSims <- 1000
nChains <- 4
prior_model <- brm(
  frml, prior = mypriors, data = myDT,
  family = brmsfamily("lognormal", link_sigma = "log"),
  stanvars = stanvar(scode = claims_dynamics,
                     block = "functions"),
  backend = "cmdstan",
  sample_prior = "only", seed = 123,
  iter = nSims, chains = nChains)
With the prior model we can draw samples from the prior predictive distribution:
# Expose Stan functions from the model to R
expose_functions(prior_model, vectorize = TRUE)
N <- ndraws(prior_model)
# Draw samples from the prior predictive
prior_pred <- predict(prior_model, ndraws = N, summary = FALSE)
Let’s take a look at the prior predictive distribution and highlight the first three simulations:
SimDT <- data.table(
  accident_year = rep(myDT$accident_year, N),
  dev = rep(myDT$dev, N),
  deltaf = rep(myDT$deltaf, N),
  Sim =  as.vector(t(prior_pred)),
  SimID = rep(1:N, each = dim(prior_pred)[2])
)
SimDT[, `Sim ID` := factor(SimID)]

library(ggfan)
library(ggplot2)
p1 <- ggplot(SimDT, aes(x = dev, y = Sim)) +
  geom_fan() +
  geom_line(data = SimDT[SimID < 4], aes(col = `Sim ID`)) +
  facet_wrap(. ~ deltaf + accident_year, ncol = ay_n) +
  scale_color_brewer(palette="YlOrRd") +
  scale_y_continuous(labels = scales::percent) +
  labs(x = "Month", y = "Incremental loss ratio",
       title = "Prior predictive loss ratio distribution") +
  theme_grey()
p1
The plot shows that most claim activity can be expected in the first development periods. As with real data, neither the actual outstanding nor paid data follows a smooth line, but the volatility reduces with development age.
Turning the simulated incremental data into cumulative paid and incurred loss ratios (incurred = cumulative paid + outstanding) illustrates nicely the impact of the imputed rate changes. The performance of the 2025 and 2026 accident years is better compared to 2024 and 2027, as expected.
SimDT[deltaf %in% "Paid" , CumSim := cumsum(Sim),
      by = list(accident_year, SimID)]
SimDT[deltaf %in% "Outstanding" , CumSim := Sim]
SimDT[, Incurred := sum(CumSim), by = .(
  accident_year, SimID, dev
)]
SimDT[deltaf %in% "Outstanding" , CumSim := Incurred]
SimDT[, Incurred := NULL]
SimDT[, deltaf2 := ifelse(deltaf %in% "Paid", "Paid", "Incurred")]

p2 <- ggplot(SimDT, aes(x = dev, y = CumSim)) +
  geom_fan()  +
  geom_line(data = SimDT[SimID < 4], aes(col = `Sim ID`)) +
  facet_wrap(. ~ deltaf2 + accident_year, ncol = ay_n) +
  scale_color_brewer(palette="YlOrRd") +
  scale_y_continuous(labels = scales::percent) +
  labs(x = "Month", y = "Cumulative loss ratio",
       title = "Prior predictive loss ratio distribution") +
  theme_grey()
p2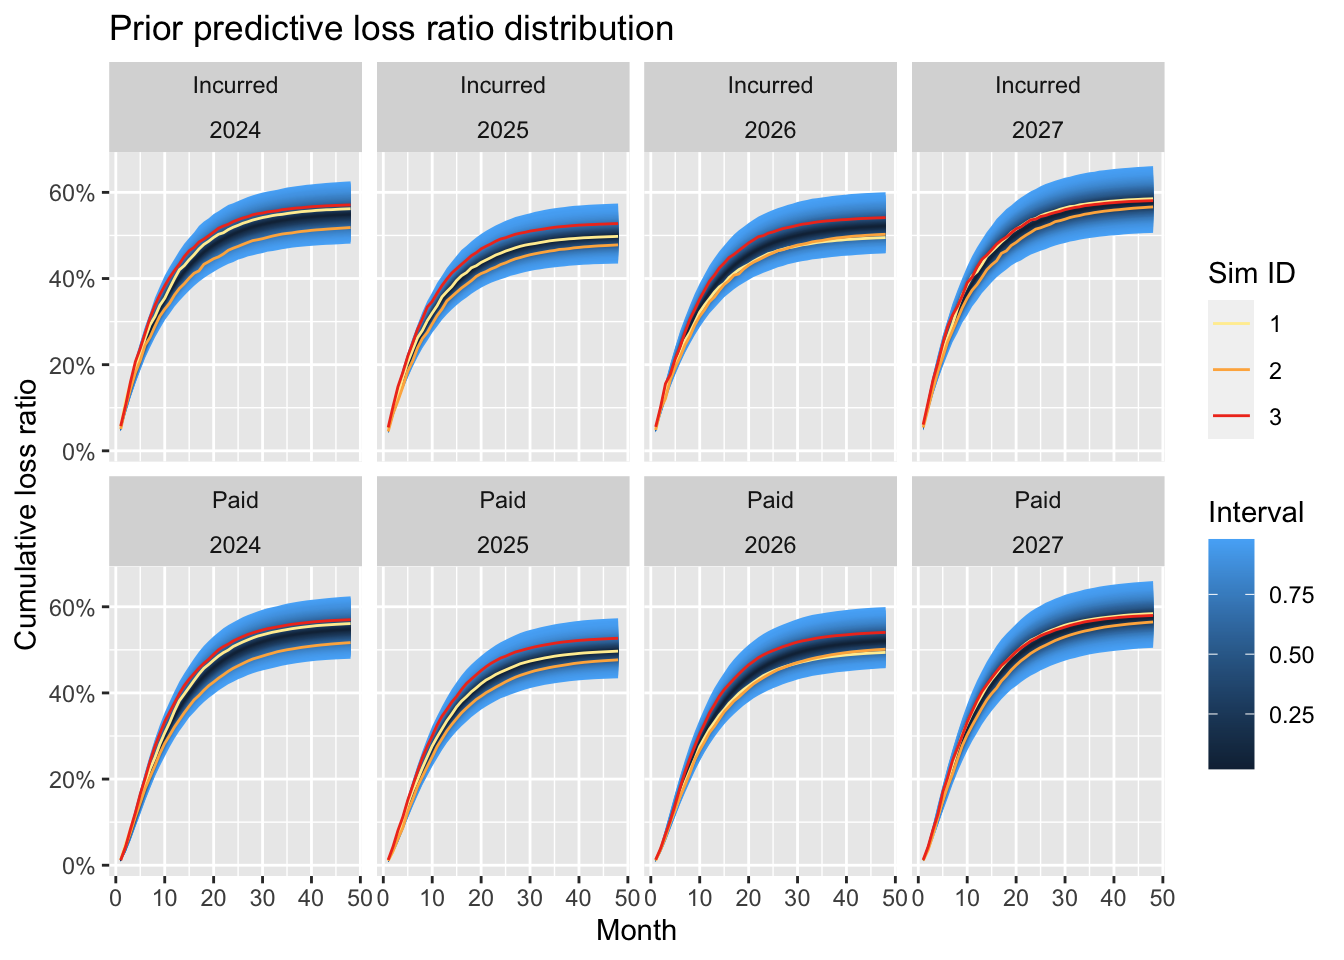
The above chart demonstrates the challenge with actual historical data, where we have only one realisation per accident year. Yet, if we have data from several clients (or policyholders), a hierarchical structure can help to extract more insight from the data, such as the impact of rate changes.
Summary
We have shown how hierarchical compartmental reserving models can be used to simulate paid and outstanding claims data using only prior assumptions. In the context of business planning this is a helpful tool to work with underwriters and management to build a business case for new initiatives, while at the same time it becomes the monitoring tool as and when those initiatives start.
For more details and in depth explanation of the model see the original paper.
Session Info
sessionInfo()## R version 4.3.1 (2023-06-16)
## Platform: aarch64-apple-darwin20 (64-bit)
## Running under: macOS Sonoma 14.0
##
## Matrix products: default
## BLAS: /Library/Frameworks/R.framework/Versions/4.3-arm64/Resources/lib/libRblas.0.dylib
## LAPACK: /Library/Frameworks/R.framework/Versions/4.3-arm64/Resources/lib/libRlapack.dylib; LAPACK version 3.11.0
##
## locale:
## [1] en_US.UTF-8/en_US.UTF-8/en_US.UTF-8/C/en_US.UTF-8/en_US.UTF-8
##
## time zone: Europe/London
## tzcode source: internal
##
## attached base packages:
## [1] stats graphics grDevices utils datasets methods base
##
## other attached packages:
## [1] ggplot2_3.4.3 ggfan_0.1.3 brms_2.20.1 Rcpp_1.0.11
## [5] data.table_1.14.8
##
## loaded via a namespace (and not attached):
## [1] tidyselect_1.2.0 dplyr_1.1.2 farver_2.1.1
## [4] loo_2.6.0 fastmap_1.1.1 tensorA_0.36.2
## [7] shinystan_2.6.0 blogdown_1.18 promises_1.2.1
## [10] shinyjs_2.1.0 digest_0.6.33 mime_0.12
## [13] lifecycle_1.0.3 StanHeaders_2.26.27 ellipsis_0.3.2
## [16] processx_3.8.2 magrittr_2.0.3 posterior_1.4.1
## [19] compiler_4.3.1 rlang_1.1.1 sass_0.4.7
## [22] tools_4.3.1 igraph_1.5.1 utf8_1.2.3
## [25] yaml_2.3.7 knitr_1.43 labeling_0.4.2
## [28] prettyunits_1.1.1 bridgesampling_1.1-2 htmlwidgets_1.6.2
## [31] pkgbuild_1.4.2 RColorBrewer_1.1-3 cmdstanr_0.6.0
## [34] plyr_1.8.8 dygraphs_1.1.1.6 abind_1.4-5
## [37] miniUI_0.1.1.1 withr_2.5.0 grid_4.3.1
## [40] stats4_4.3.1 fansi_1.0.4 xts_0.13.1
## [43] xtable_1.8-4 colorspace_2.1-0 inline_0.3.19
## [46] scales_1.2.1 gtools_3.9.4 cli_3.6.1
## [49] mvtnorm_1.2-2 crayon_1.5.2 rmarkdown_2.24
## [52] generics_0.1.3 RcppParallel_5.1.7 rstudioapi_0.15.0
## [55] reshape2_1.4.4 cachem_1.0.8 rstan_2.21.8
## [58] stringr_1.5.0 shinythemes_1.2.0 bayesplot_1.10.0
## [61] parallel_4.3.1 matrixStats_1.0.0 base64enc_0.1-3
## [64] vctrs_0.6.3 Matrix_1.6-1 jsonlite_1.8.7
## [67] callr_3.7.3 bookdown_0.35 crosstalk_1.2.0
## [70] jquerylib_0.1.4 glue_1.6.2 codetools_0.2-19
## [73] ps_1.7.5 DT_0.28 distributional_0.3.2
## [76] stringi_1.7.12 gtable_0.3.3 later_1.3.1
## [79] munsell_0.5.0 tibble_3.2.1 colourpicker_1.2.0
## [82] pillar_1.9.0 htmltools_0.5.6 Brobdingnag_1.2-9
## [85] RcppEigen_0.3.3.9.3 R6_2.5.1 evaluate_0.21
## [88] shiny_1.7.5 lattice_0.21-8 highr_0.10
## [91] markdown_1.7 backports_1.4.1 threejs_0.3.3
## [94] httpuv_1.6.11 bslib_0.5.1 rstantools_2.3.1.1
## [97] coda_0.19-4 gridExtra_2.3 nlme_3.1-163
## [100] checkmate_2.2.0 xfun_0.40 zoo_1.8-12
## [103] pkgconfig_2.0.3Citation
For attribution, please cite this work as:Markus Gesmann (Aug 21, 2023) Hierarchical Compartmental Reserving Models for Business Planning. Retrieved from https://magesblog.com/post/2023-08-21-hierarchical-compartmental-reserving-models-for-business-planning/
@misc{ 2023-hierarchical-compartmental-reserving-models-for-business-planning,
author = { Markus Gesmann },
title = { Hierarchical Compartmental Reserving Models for Business Planning },
url = { https://magesblog.com/post/2023-08-21-hierarchical-compartmental-reserving-models-for-business-planning/ },
year = { 2023 }
updated = { Aug 21, 2023 }
}