Reserving based on log-incremental payments in R, part I
A recent post on the PirateGrunt blog on claims reserving inspired me to look into the paper Regression models based on log-incremental payments by Stavros Christofides [1], published as part of the Claims Reserving Manual (Version 2) of the Institute of Actuaries.
The paper is available together with a spreadsheet model, illustrating the calculations. It is very much based on ideas by Barnett and Zehnwirth, see [2] for a reference. However, doing statistical analysis in a spread sheet programme is often cumbersome. I will go through the first 15 pages of Christofides’ paper today and illustrate how the model can be implemented in R.
Let’s start with the example data of an incremental claims triangle:
## Page D5.4
tri <- t(matrix(
  c(11073,  6427, 1839, 766,
    14799,  9357, 2344,  NA,
    15636, 10523,   NA,  NA,
    16913,    NA,   NA,  NA),
  nc = 4,
  dimnames=list(origin = 0:3, dev = 0:3)))
The above triangle shows incremental claims payments for four origin (accident) years over time (development years). It is the aim to predict the bottom right triangle of future claims payments, assuming no further claims after four development years.
Christofides model assumes the following structure for the incremental paid claims \(P_{ij}\):
\[\begin{aligned} \ln(P_{ij}) & = Y_{ij} = a_i + b_j + \epsilon_{ij} \end{aligned}\]where i and j go from 0 to 3, \(b_0=0\) and \(\epsilon_{ij} \sim N(0, \sigma^2)\). Unlike the basic chain-ladder method, this is a stochastic model that allows me to test my assumptions and calculate various statistics, e.g. standards errors of my predictions. For the purpose of my analysis I will work with the data in form of a data frame:
m <- dim(tri)[1]; n <- dim(tri)[2]
dat <- data.frame(
  origin=rep(0:(m-1), n),
  dev=rep(0:(n-1), each=m),
  value=as.vector(tri))

rownames(dat) <- with(dat, paste(origin, dev, sep="-"))
dat <- dat[order(dat$origin),]
dat
## origin dev value
## 0-0 0 0 11073
## 0-1 0 1 6427
## 0-2 0 2 1839
## 0-3 0 3 766
## 1-0 1 0 14799
## 1-1 1 1 9357
## 1-2 1 2 2344
## 1-3 1 3 NA
## 2-0 2 0 15636
## 2-1 2 1 10523
## 2-2 2 2 NA
## 2-3 2 3 NA
## 3-0 3 0 16913
## 3-1 3 1 NA
## 3-2 3 2 NA
## 3-3 3 3 NAI add a few columns to my data, in particular factor variables of the origin and development years, a calendar year dimension and the log value of the paid claims.
## Add dimensions as factors
dat <- with(dat, data.frame(origin, dev, cal=origin+dev,
                            value, logvalue=log(value),
                            originf=factor(origin),
                            devf=as.factor(dev),
                            calf=as.factor(origin+dev)))

rownames(dat) <- with(dat, paste(origin, dev, sep="-"))
dat <- dat[order(dat$origin),]

dat ## Page D5.7
## origin dev cal value logvalue originf devf calf
## 0-0 0 0 0 11073 9.312265 0 0 0
## 0-1 0 1 1 6427 8.768263 0 1 1
## 0-2 0 2 2 1839 7.516977 0 2 2
## 0-3 0 3 3 766 6.641182 0 3 3
## 1-0 1 0 1 14799 9.602315 1 0 1
## 1-1 1 1 2 9357 9.143880 1 1 2
## 1-2 1 2 3 2344 7.759614 1 2 3
## 1-3 1 3 4 NA NA 1 3 4
## 2-0 2 0 2 15636 9.657331 2 0 2
## 2-1 2 1 3 10523 9.261319 2 1 3
## 2-2 2 2 4 NA NA 2 2 4
## 2-3 2 3 5 NA NA 2 3 5
## 3-0 3 0 3 16913 9.735838 3 0 3
## 3-1 3 1 4 NA NA 3 1 4
## 3-2 3 2 5 NA NA 3 2 5
## 3-3 3 3 6 NA NA 3 3 6I have done all the preparation and can carry out the linear regression with lm:
Fit <- lm(logvalue ~ originf + devf + 0, data=dat)
summary(Fit) # Page D5.7/8
##
## Call:
## lm(formula = logvalue ~ originf + devf + 0, data = dat)
##
## Residuals:
## 0-0 0-1 0-2 0-3 1-0 1-1 1-2
## 2.389e-02 -5.396e-02 3.007e-02 6.939e-18 1.118e-02 1.889e-02 -3.007e-02
## 2-0 2-1 3-0
## -3.507e-02 3.507e-02 0.000e+00
##
## Coefficients:
## Estimate Std. Error t value Pr(>|t|)
## originf0 9.28837 0.04001 232.17 1.76e-07 ***
## originf1 9.59114 0.04001 239.73 1.60e-07 ***
## originf2 9.69240 0.04277 226.62 1.89e-07 ***
## originf3 9.73584 0.05238 185.86 3.43e-07 ***
## devf1 -0.46615 0.04277 -10.90 0.00165 **
## devf2 -1.80146 0.05015 -35.92 4.75e-05 ***
## devf3 -2.64719 0.06591 -40.16 3.40e-05 ***
## ---
## Signif. codes: 0 '***' 0.001 '**' 0.01 '*' 0.05 '.' 0.1 ' ' 1
##
## Residual standard error: 0.05238 on 3 degrees of freedom
## (6 observations deleted due to missingness)
## Multiple R-squared: 1, Adjusted R-squared: 1
## F-statistic: 4.03e+04 on 7 and 3 DF, p-value: 1.884e-07The above output shows the same results as the paper. The estimators for the origin periods are clearly different from zero, yet the tests for originf1 to originf3 don’t make much sense. It would be more appropriate to understand if I need different parameters for each origin period and hence a model such as lm(logvalue ~ originf + devf, data=dat) can be more helpful. It would test the coefficients of the later origin periods against the base of the first one.
Lets look at the residuals:
# Resdiual plots
op <- par(mfrow=c(2,2))
attach(model.frame(Fit))
plot.default(rstandard(Fit) ~ originf,
             main="Residuals vs. origin years")
abline(h=0, lty=2)
plot.default(rstandard(Fit) ~ devf,
             main="Residuals vs. dev. years")
abline(h=0, lty=2)
with(na.omit(dat),
     plot.default(rstandard(Fit) ~ calf,
                  main="Residuals vs. payments years"))
abline(h=0, lty=2)
plot.default(rstandard(Fit) ~ logvalue,
             main="Residuals vs. fitted")
abline(h=0, lty=2)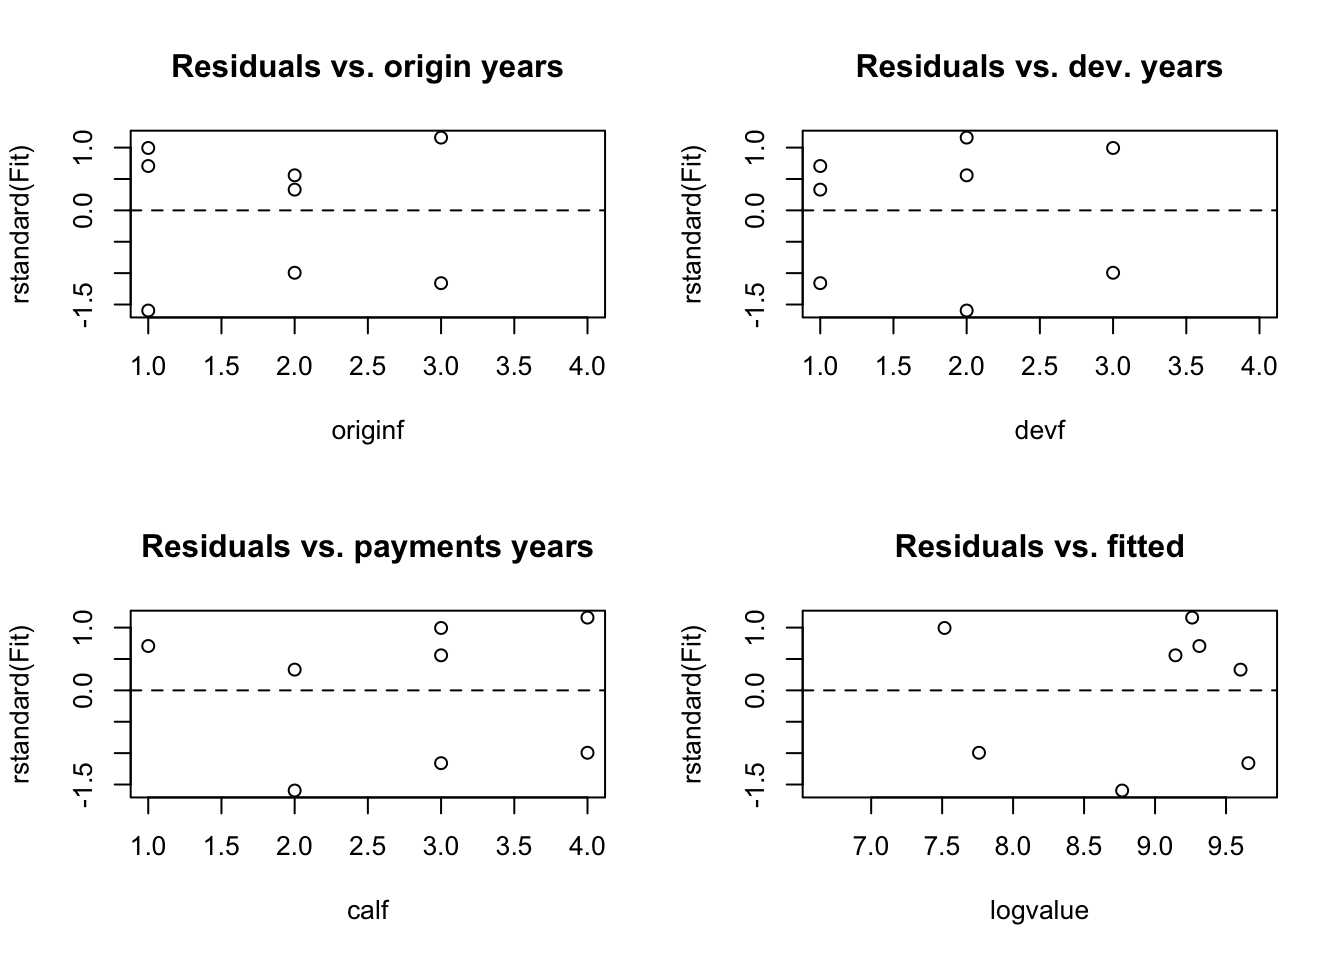
detach(model.frame(Fit))
par(op)
The residual plots don’t give any reason to dismiss the model, so I continue.
In my next step I extract the design matrix from the model and build the future design matrix from the data. I will need both to calculate the prediction and standard errors on the original scale to follow the paper:
# Model design matrix, page D5.7
dm <- model.matrix(formula(Fit), dat=model.frame(Fit))
dm
## originf0 originf1 originf2 originf3 devf1 devf2 devf3
## 0-0 1 0 0 0 0 0 0
## 0-1 1 0 0 0 1 0 0
## 0-2 1 0 0 0 0 1 0
## 0-3 1 0 0 0 0 0 1
## 1-0 0 1 0 0 0 0 0
## 1-1 0 1 0 0 1 0 0
## 1-2 0 1 0 0 0 1 0
## 2-0 0 0 1 0 0 0 0
## 2-1 0 0 1 0 1 0 0
## 3-0 0 0 0 1 0 0 0
## attr(,"assign")
## [1] 1 1 1 1 2 2 2
## attr(,"contrasts")
## attr(,"contrasts")$originf
## [1] "contr.treatment"
##
## attr(,"contrasts")$devf
## [1] "contr.treatment"## Future design matrix, page D5.11
fdm <- model.matrix( ~ originf + devf + 0, data=dat[is.na(dat$value),])
fdm## originf0 originf1 originf2 originf3 devf1 devf2 devf3
## 1-3 0 1 0 0 0 0 1
## 2-2 0 0 1 0 0 1 0
## 2-3 0 0 1 0 0 0 1
## 3-1 0 0 0 1 1 0 0
## 3-2 0 0 0 1 0 1 0
## 3-3 0 0 0 1 0 0 1
## attr(,"assign")
## [1] 1 1 1 1 2 2 2
## attr(,"contrasts")
## attr(,"contrasts")$originf
## [1] "contr.treatment"
##
## attr(,"contrasts")$devf
## [1] "contr.treatment"Following the paper I can calculate the variance-covariance matrix:
# Page D5.12
# fdm %*% solve(t(dm)%*%dm) %*% t(fdm) *sigma^2, or shorter
varcovar <- fdm %*% vcov(Fit) %*% t(fdm)
round(varcovar,4)
## 1-3 2-2 2-3 3-1 3-2 3-3
## 1-3 0.0046 0.0000 0.0037 0.0000 0.0000 0.0037
## 2-2 0.0000 0.0034 0.0021 0.0000 0.0021 0.0007
## 2-3 0.0037 0.0021 0.0053 0.0000 0.0007 0.0039
## 3-1 0.0000 0.0000 0.0000 0.0046 0.0037 0.0037
## 3-2 0.0000 0.0021 0.0007 0.0037 0.0053 0.0039
## 3-3 0.0037 0.0007 0.0039 0.0037 0.0039 0.0071With the above matrix I can derive the variance of my future values, which are the diagonal elements of the above matrix plus the model variance \(\sigma^2\). Now I have everything to calculate the future claims amounts and standard errors on the original scale. Recall that for a lognormal distribution I have \(E(X) = \exp(\mu + \frac{1}{2} \sigma^2)\) and \(Var(X) = \exp(2\mu + \sigma^2)(\exp(\sigma^2) - 1)\).
# Page D5.12
sigma <- summary(Fit)$sigma
sigma
## [1] 0.05238207# 0.05238207
Var <- varcovar + sigma^2
VarY <- diag(Var)
Y <- fdm %*% coef(Fit)
P <- exp(Y + VarY/2)
VarP <- exp(2*Y + VarY)*(exp(VarY)-1)
seP <- sqrt(VarP)
i <- fdm %*% c((1:m)-1, rep(0, (n-1)))
j <- fdm %*% c(rep(0, (m-1)), (1:n)-1)
Results <- data.frame(i,j, Y, VarY, P, VarP, seP)
Results # Page D5.13## i j Y VarY P VarP seP
## 1-3 1 3 6.943950 0.007317016 1040.658 7953.165 89.18052
## 2-2 2 2 7.890940 0.006173732 2681.219 44519.839 210.99725
## 2-3 2 3 7.045210 0.008002987 1151.950 10662.490 103.25933
## 3-1 3 1 9.269688 0.007317016 10650.334 833010.240 912.69395
## 3-2 3 2 7.934378 0.008002987 2802.814 63121.859 251.24064
## 3-3 3 3 7.088648 0.009832241 1204.192 14327.851 119.69900Well, it is actually easier in R, as I could have used the function predict, which does most of the above behind the scene:
newData <- dat[is.na(dat$logvalue), c("originf", "devf")]
Pred <- predict(Fit, newdata=newData, se.fit=TRUE)
Y <- Pred$fit
VarY <- Pred$se.fit^2 + Pred$residual.scale^2
fdm <- model.matrix(~ originf + devf + 0, data=newData)
Never-mind, let’s complete the triangle:
lower.tri <- xtabs(P ~ i+j, dat=Results)
lower.tri
## j
## i 1 2 3
## 1 0.000 0.000 1040.658
## 2 0.000 2681.219 1151.950
## 3 10650.334 2802.814 1204.192Full.Incr.Triangle <- tri
Full.Incr.Triangle[row(tri) > (nrow(tri) + 1 - col(tri))] <-
lower.tri[row(lower.tri) > (nrow(lower.tri) - col(lower.tri))]
Full.Cum.Triangle <- apply(Full.Incr.Triangle, 1, cumsum)
Full.Cum.Triangle## dev
## origin 0 1 2 3
## 0 11073 14799.00 15636.00 16913.00
## 1 17500 24156.00 26159.00 27563.33
## 2 19339 26500.00 28840.22 30366.15
## 3 20105 27540.66 29992.17 31570.34Finally I want to estimate the overall error for my total reserve, the sum of all future incremental claims payments. I have all the values already and using the sweep statement in R it is easy to calculate the overall variance for the total reserve, but I have to account for the co-variances first:
# Page D5.14
# Calculate the co-variance between the predictions
CoVar <-  sweep(sweep((exp(varcovar)-1), 1, P, "*"), 2, P, "*")
# I set the values on the diagonal to zero as I have to use
# the variances I calculated earlier (VarP),
# which includes the model variance sigma^2 as well.
CoVar[col(CoVar)==row(CoVar)] <- 0
round(CoVar,0)
## 1-3 2-2 2-3 3-1 3-2 3-3
## 1-3 0 0 4394 0 0 4593
## 2-2 0 0 6363 0 15481 2216
## 2-3 4394 6363 0 0 2216 5403
## 3-1 0 0 0 0 109410 47006
## 3-2 0 15481 2216 109410 0 13145
## 3-3 4593 2216 5403 47006 13145 0# Add the variances together to estimate the overall variance
OverallVar <- sum(CoVar) + sum(VarP)
Total.SE <- sqrt(OverallVar)
Total.SE## [1] 1180.698Overall.Reserve <- sum(lower.tri)
Overall.Reserve## [1] 19531.17Total.SE / Overall.Reserve## [1] 0.06045198That’s it, the projected reserve is 119,531 with an estimated overall standard error of 11,181 or just 6% of the overall reserve estimate.
For comparison here is the output of a Mack chain-ladder model [3] run on the same triangle using the ChainLadder package [4]:
library(ChainLadder)##
## Welcome to ChainLadder version 0.2.16
## To cite package 'ChainLadder' in publications use:
##
## Gesmann M, Murphy D, Zhang Y, Carrato A, Wuthrich M, Concina F, Dal
## Moro E (2022). _ChainLadder: Statistical Methods and Models for
## Claims Reserving in General Insurance_. R package version 0.2.16,
## <https://mages.github.io/ChainLadder/>.
##
## To suppress this message use:
## suppressPackageStartupMessages(library(ChainLadder))M <- MackChainLadder(incr2cum(tri), est.sigma="Mack")
M$FullTriangle## dev
## origin 0 1 2 3
## 0 11073 17500.00 19339.00 20105.00
## 1 14799 24156.00 26500.00 27549.64
## 2 15636 26159.00 28785.83 29926.01
## 3 16913 27632.15 30406.90 31611.29M## MackChainLadder(Triangle = incr2cum(tri), est.sigma = "Mack")
##
## Latest Dev.To.Date Ultimate IBNR Mack.S.E CV(IBNR)
## 0 20,105 1.000 20,105 0 0.0 NaN
## 1 26,500 0.962 27,550 1,050 31.3 0.0298
## 2 26,159 0.874 29,926 3,767 177.1 0.0470
## 3 16,913 0.535 31,611 14,698 948.7 0.0645
##
## Totals
## Latest: 89,677.00
## Dev: 0.82
## Ultimate: 109,191.94
## IBNR: 19,514.94
## Mack.S.E 980.34
## CV(IBNR): 0.05The Mack chain-ladder results are actually quite similar to the log-linear model, but provide only point estimators without a distribution.
Conclusions
It is actually very straightforward to implement the regression model based on log-incremental payments in R. In particular I can run my code for any other triangle size without having to adjust any of my formulas, something which can sometimes be quite time-intensive and error prone to do in spread sheets.
Here is the reduced model of the second example in Christofides’ paper, which I cover in more detail in a second post.:
dat <- data.frame( # Page D5.17
  origin = rep(0:6, each=7),
  dev = rep(0:6, 7),
  value = c(3511,  3215,  2266,  1712, 1059, 587, 340,
            4001,  3702,  2278, 1180, 956, 629,  NA,
            4355,  3932,  1946, 1522, 1238,  NA,  NA,
            4295,  3455,  2023, 1320,   NA,  NA,  NA,
            4150,  3747,  2320,   NA,   NA,  NA,  NA,
            5102,  4548,    NA,   NA,   NA,  NA,  NA,
            6283,    NA,    NA,   NA,   NA,  NA,  NA))

dat <- with(dat,
            data.frame(origin, dev, cal=origin+dev,
                       value, logvalue=log(value),
                       a6 = ifelse(origin == 6, 1, 0),
                       a5 = ifelse(origin == 5, 1, 0),
                       d = ifelse(dev < 1, 1, 0),
                       s = ifelse(dev < 1, 0, dat$dev)))

summary(Fit <- lm(logvalue ~ a5 + a6 + d + s, data=na.omit(dat)))
##
## Call:
## lm(formula = logvalue ~ a5 + a6 + d + s, data = na.omit(dat))
##
## Residuals:
## Min 1Q Median 3Q Max
## -0.21567 -0.04910 0.00654 0.05137 0.27198
##
## Coefficients:
## Estimate Std. Error t value Pr(>|t|)
## (Intercept) 8.60795 0.05150 167.142 < 2e-16 ***
## a5 0.24353 0.08517 2.859 0.008870 **
## a6 0.44111 0.12170 3.625 0.001421 **
## d -0.30345 0.06779 -4.476 0.000172 ***
## s -0.43967 0.01666 -26.390 < 2e-16 ***
## ---
## Signif. codes: 0 '***' 0.001 '**' 0.01 '*' 0.05 '.' 0.1 ' ' 1
##
## Residual standard error: 0.1119 on 23 degrees of freedom
## Multiple R-squared: 0.9804, Adjusted R-squared: 0.977
## F-statistic: 287.7 on 4 and 23 DF, p-value: < 2.2e-16I am sure there are better ways to fit such models in R, in particular in dealing with the design matrix and changing them, e.g. to reduce the model and take out non-significant factor levels, although this seems to be a bit of a no-no.
Jim Guszcza has a few more tips on reserving in his webinar on Actuarial Analytics in R and the ChainLadder package has further stochastic reserving methods already implemented.
You find the code of this post also as a gist on Github. Feedback, comments, tips and hints will be much appreciated.
References
[1] Stavros Christofides. Regression models based on log-incremental payments. Claims Reserving Manual. Volume 2 D5. September 1997
[2] Glen Barnett and Ben Zehnwirth. Best estimates for reserves. Proceedings of the CAS, LXXXVII(167), November 2000.
[3] Thomas Mack. The standard error of chain ladder reserve estimates: Recursive calculation and inclusion of a tail factor. Astin Bulletin, Vol. 29(2):361 – 266, 1999.
[4] Markus Gesmann, Dan Murphy, and Wayne Zhang. ChainLadder: Mack-, Bootstrap and Munich-chain-ladder methods for insurance claims reserving, 2012. R package version 0.1.5-4.
Session Info
R version 2.15.2 Patched (2013-01-01 r61512)
Platform: x86_64-apple-darwin9.8.0/x86_64 (64-bit)

locale:
[1] en_GB.UTF-8/en_GB.UTF-8/en_GB.UTF-8/C/en_GB.UTF-8/en_GB.UTF-8

attached base packages:
[1] grid splines stats graphics grDevices utils datasets methods base

other attached packages:
[1] ChainLadder_0.1.5-4 tweedie_2.1.5 statmod_1.4.16  cplm_0.6-4
lme4_0.999999-0  ggplot2_0.9.3 coda_0.16-1 biglm_0.8 DBI_0.2-5
reshape2_1.2.2 actuar_1.1-5 RUnit_0.4.26 systemfit_1.1-14 lmtest_0.9-30
zoo_1.7-9 car_2.0-15 nnet_7.3-5 MASS_7.3-22 Matrix_1.0-10 lattice_0.20-10
Hmisc_3.10-1 survival_2.37-2

loaded via a namespace (and not attached):
[1] cluster_1.14.3 colorspace_1.2-0 dichromat_1.2-4 digest_0.6.0
gtable_0.1.2 labeling_0.1 minqa_1.2.1 munsell_0.4 nlme_3.1-106
plyr_1.8 proto_0.3-10 RColorBrewer_1.0-5 sandwich_2.2-9 scales_0.2.3
stats4_2.15.2 stringr_0.6.2
Citation
For attribution, please cite this work as:Markus Gesmann (Jan 08, 2013) Reserving based on log-incremental payments in R, part I. Retrieved from https://magesblog.com/post/2013-01-08-reserving-based-on-log-incremental/
@misc{ 2013-reserving-based-on-log-incremental-payments-in-r-part-i,
author = { Markus Gesmann },
title = { Reserving based on log-incremental payments in R, part I },
url = { https://magesblog.com/post/2013-01-08-reserving-based-on-log-incremental/ },
year = { 2013 }
updated = { Jan 08, 2013 }
}